Manufacturers love to tell you a lens is “razor sharp,” but marketing words are cheap. When optical engineers want to show what a lens can actually resolve, they reach for a single graph: the MTF chart. It looks intimidating — a tangle of curves on a grid — but once you know what the axes mean, you can judge a lens’s sharpness in about thirty seconds, before you ever spend a dollar.
Here’s how to read one, and why Sony, Canon, and Nikon all publish these charts for their high-end lenses.
What an MTF chart actually measures
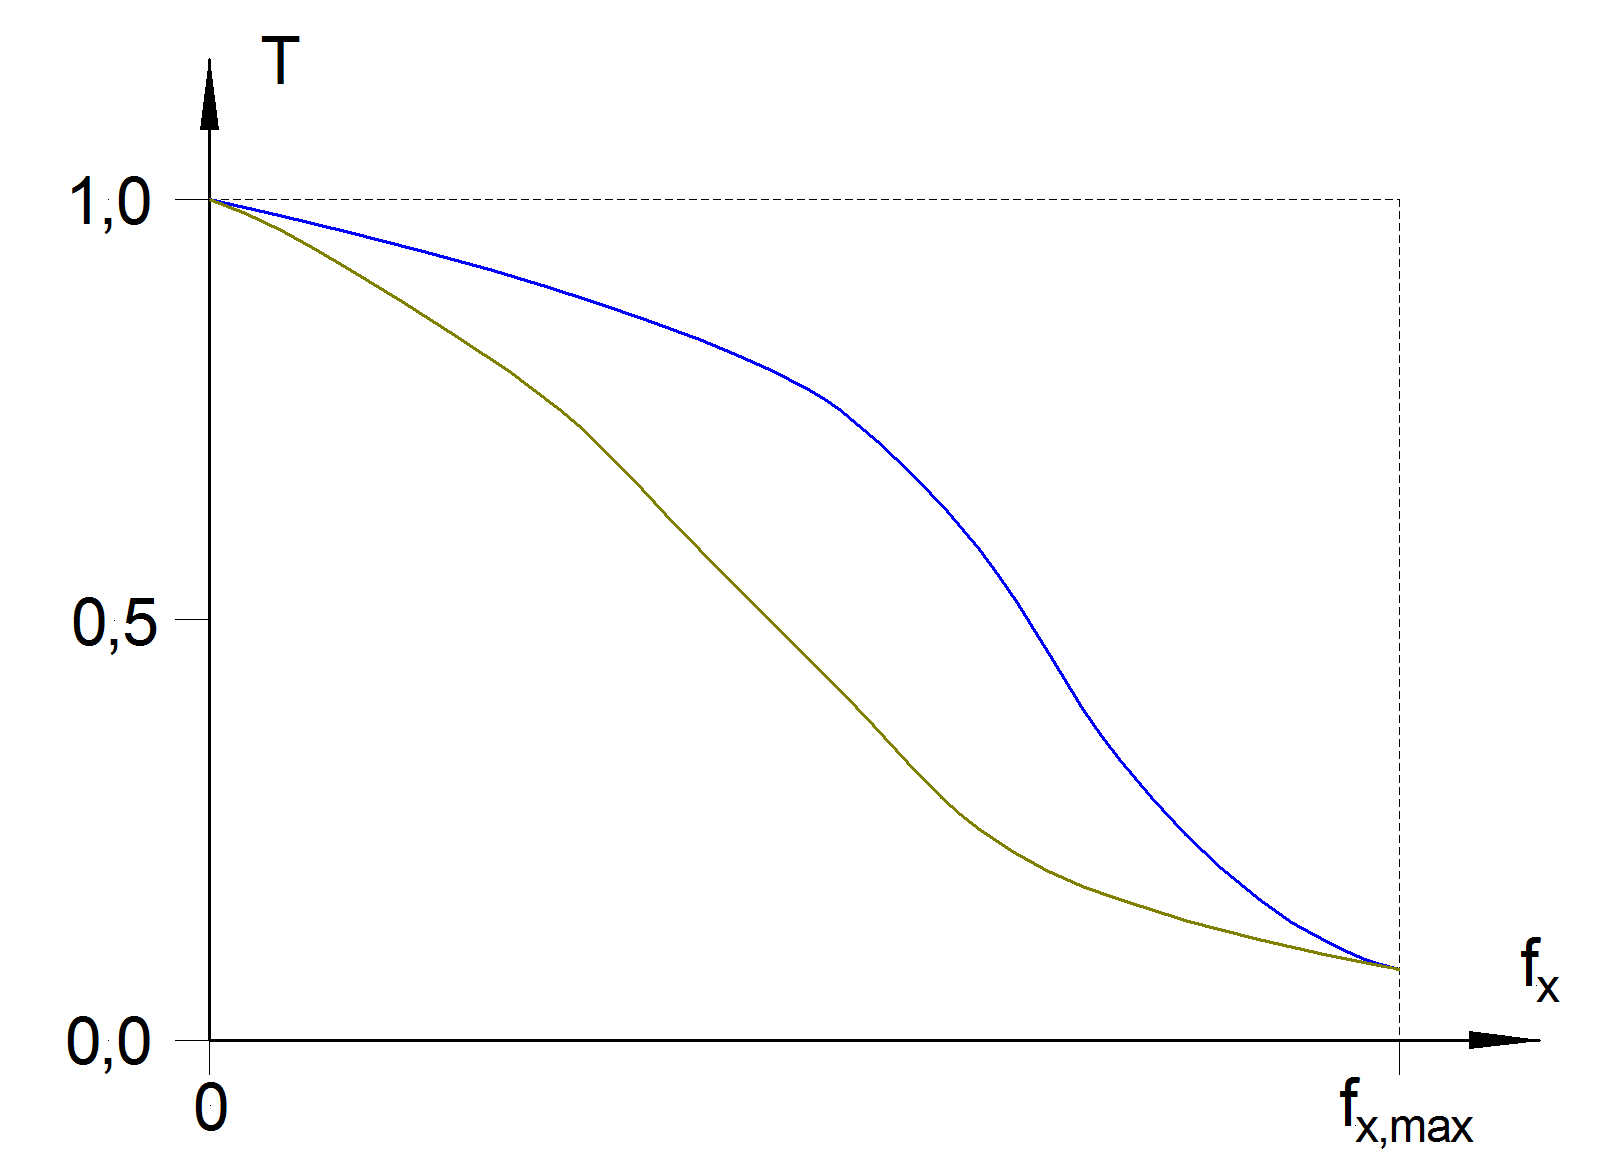
MTF stands for Modulation Transfer Function. In plain English, it measures how well a lens preserves contrast as the subject detail gets finer. Engineers photograph a target of alternating black-and-white lines and measure how much contrast survives the trip through the glass. As the lines get closer together, every lens eventually smears them into gray, and the measured contrast drops toward zero.
Detail is measured in line pairs per millimeter (lp/mm): how many black-and-white line pairs fit into one millimeter. A value of 10 lp/mm represents fairly coarse detail — the kind that gives an image its overall “punch.” A value of 30 lp/mm represents fine detail, the texture that separates a sharp lens from a soft one.

Reading the axes
Two axes do most of the work:
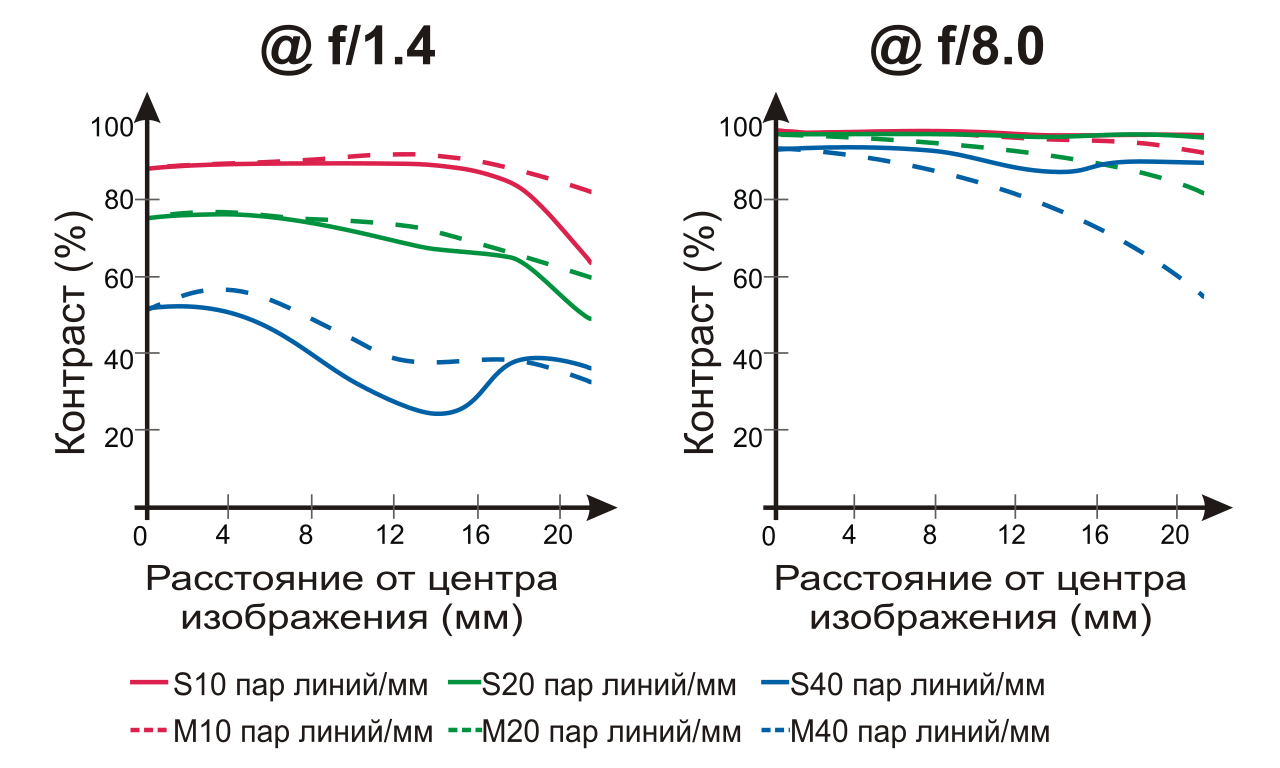
- The horizontal axis is distance from the center of the image, in millimeters. Zero is dead center; the right edge of the graph is the corner of the frame (about 21.6 mm for a full-frame sensor, less for APS-C and Micro Four Thirds).
- The vertical axis is the MTF value itself, from 0 to 1 (or 0–100%). A value of 1 means the lens transferred contrast perfectly; 0 means it resolved nothing at that level of detail.
Each curve on the chart plots that transfer value from center to corner at one specific frequency and aperture. The higher a curve sits, and the flatter it stays, the better the lens.
Sagittal, meridional, and the lines that matter
Every MTF chart draws at least two families of lines:
- Sagittal (S) lines, usually solid, measure detail running radially — lines pointing out from the center like spokes of a wheel.
- Meridional (M) lines, usually dashed, measure detail running tangentially — lines that wrap around the center.
When the solid and dashed curves sit close together, the lens resolves detail evenly in every direction. When they diverge, especially toward the corners, the lens has astigmatism and will smear fine texture in one orientation — a common sign of a weaker optical design.

What a “good” lens looks like
Three signs separate a great MTF chart from an average one:
- High and flat. Curves that start near the top and barely sag toward the right edge mean the lens is sharp from center to corner.
- Small gap between frequencies. If the 10 lp/mm and 30 lp/mm curves stay close, the lens holds fine detail as well as coarse contrast.
- Wide-open performance. Many charts plot two apertures — the lens wide open (say f/1.4) and stopped down (f/8). The closer the wide-open curves sit to the f/8 curves, the more usable the lens is at its maximum aperture.
A curve that plunges on the right side tells you the corners will look soft; a chart where wide-open lines collapse means you’ll need to stop down for crisp results.
How the big brands publish charts
Canon publishes MTF charts for its RF and L-series lenses, typically plotting 10 and 30 lp/mm at maximum aperture and f/8. Sony does the same for its G Master lineup, and Nikon for S-line NIKKOR glass. The conventions are close enough that you can compare charts across brands with a little care.
The limits of MTF charts
MTF curves are powerful, but they are not the whole story. Most published charts are computed from the optical design rather than measured from production lenses, so real-world copy variation isn’t shown. They also say nothing about bokeh quality, color rendering, flare resistance, or focus breathing — and they are usually calculated at infinity focus, not at the close distances many photographers use. Treat an MTF chart as a sharpness preview, then confirm with real reviews and sample images.
Conclusion
An MTF chart is the closest thing the camera industry has to an honest sharpness score. Learn the axes — distance on the bottom, contrast on the side — and the two families of lines, and you can read any lens spec sheet like an engineer. It won’t tell you everything about a lens, but it will tell you exactly where it’s sharp, and where it isn’t.
FAQ
Is a higher MTF value always better?
Yes — within the same frequency and aperture, a higher value means more contrast and therefore a sharper image. Just make sure you’re comparing like with like.
What does “lp/mm” mean?
Line pairs per millimeter. It describes how many black-and-white line pairs fit in one millimeter of the sensor, so higher values mean finer, more demanding detail.
Are published MTF charts from real lenses?
Usually not. Most are calculated from the optical design before manufacturing. They predict performance accurately in aggregate but don’t reflect sample-to-sample variation.
Can I use an MTF chart to compare a zoom lens?
Partly. Zooms are usually charted at several focal lengths and apertures, so compare the charts for the specific focal length and aperture you plan to shoot at.
Related Posts
Stacked CMOS Sensors Explained: How They Work and Why They Matter
APS-C CMOS image sensor. Photo: Friedrich Haag, CC BY-SA 4.0,…
CMOS vs CCD Sensors: What’s the Difference?
Every digital camera you’ve ever held — from an early-2000s…
Mirrorless Camera Design: How Removing the Mirror Changed Cameras
For most of the twentieth century, the single-lens reflex (SLR)…